Jorma Sajaniemi
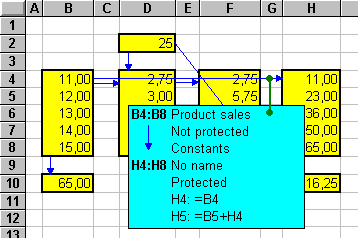
Computations in spreadsheets are hard to grasp and consequently many errors remain unnoticed. The problem with the hidden errors lies in the invisibility of the structure of calculations. The S2 Visualization tool consists of an Excel macro that can be used to superimpose a graphical visualization on the spreadsheet display.
The S2 visualization marks with yellow coloring and a thick border areas (so called S areas) that contain values having the same type and equal format as well as areas having an formula that could be obtained by copying from each other. Moreover, a S area can contain at any edge cell a formula that can be obtained by removing from the the copy in the neighbor cell all references to the cells at that edge and copying that formula. Blue arrows connect areas: There is an arrow from an area A to an area B if any formula in the area B refers to any cell in the area A. Moreover, if some cells in the area A are not referenced in the area B, then the area A is split into smaller subareas so that in each resulting subarea either each cell is referenced in the area B or no cell is referenced. The area B, that caused the splitting, is colored orange. An area A is not, however, split by an area B, if the area A has at one edge formulae with some references removed (as described above) and cells in the area B refer to cells at the opposite edge of the area A but not to other cells. The splitting does not propagate, i.e., the subareas that form the split area A are treated as a single area when further splitting effects are considered.
The S3 visualization is an enhanced version of the S2 visualization.
For more information on the S2 and S3 visualizations, see "Modeling Spreadsheet Audit: A Rigorous Approach to Automatic Visualization" by Jorma Sajaniemi (Journal of Visual Languages and Computing 11(1), 49-82).

Download S2 and S3 Visualization Tools for Excel